TL;DR
- Follow one car through the lane. Each stop has its own clock: greet time, the order, the wait for food, window time and departure.
- Cars per hour is the result of those timings added together, so work on them in lane order, starting at the speaker.
- Across ~1,000 stores, Hi Auto’s greeting typically lands within 3-5 seconds and average response time is 1.52 seconds.
- Time the rest of the lane yourself, by daypart, and change one thing at a time.
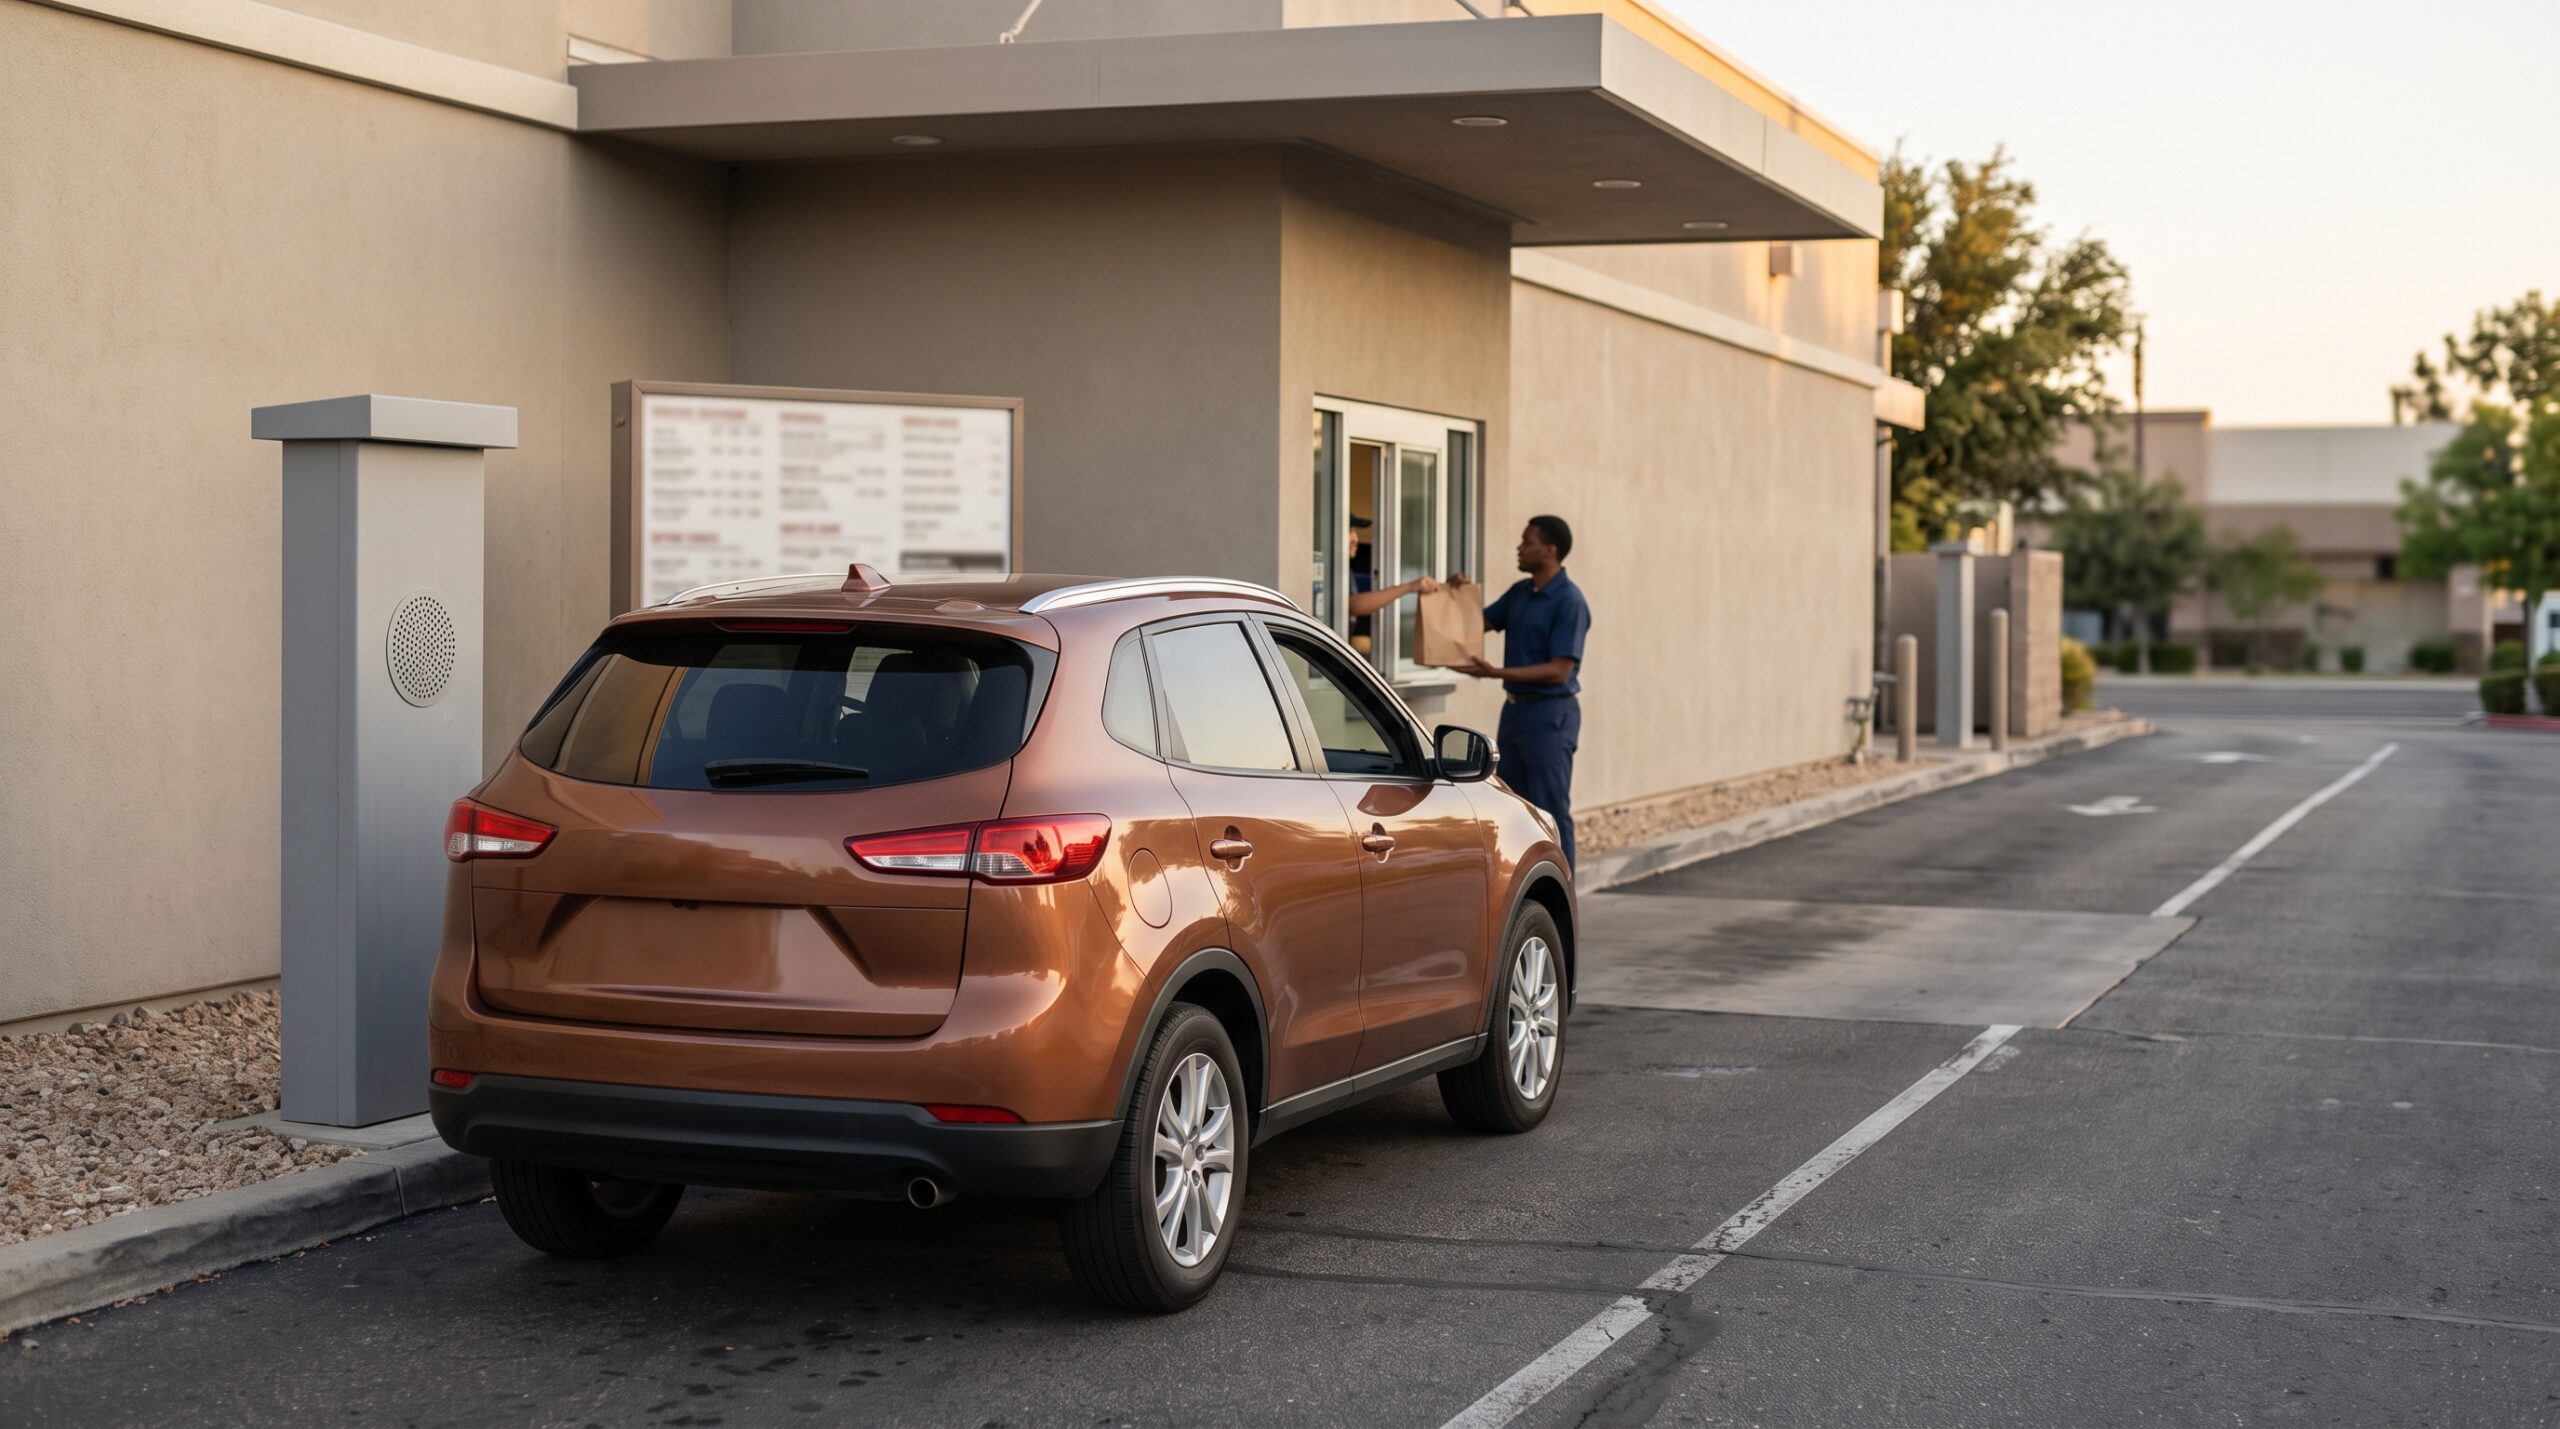
It is 12:07 on a Tuesday. A car pulls up to the speaker, and a clock starts. It keeps running until that car clears the window.
Several timings sit between those two moments. Each belongs to a different part of the lane, and each responds to a different fix. Many operators watch window time closely. Fewer know which earlier timing is pushing it up.
This guide follows one car through the lane in the order a guest meets each stop, shows who owns each timing, and suggests which to work on first. It also gives you questions to ask when a vendor says AI will make your lane faster.
One Car, Five Stops
Here is the sequence, with a one-line reminder of each term and a link to the glossary.
- Greet. How quickly the guest hears a voice after arriving at the speaker. That is greet time.
- Order. The conversation at the speaker, from greeting to a confirmed order. The pauses inside it are covered by response time, the delay between a guest finishing a sentence and the reply.
- Wait for food. Kitchen prep and assembly while the car moves forward.
- Window. Payment and handoff. This is window time, from arrival at the window to departure with the order.
- Departure. The car leaves. Transaction time covers the whole visit from the first interaction at the speaker through receipt of food.
Wrapping all of it is speed of service, the total time a guest spends in the lane. Our published article, What Is Speed of Service in a Drive-Thru?, covers that picture in full, so this guide stays with the individual stops.
Cars per hour is what these timings add up to. It is a result and not a separate dial. The practical question is which stops you can actually move.
Greet Time and Response Time: What the Order Point Controls
Two timings live at the speaker. Everything after them depends on the kitchen, the crew and the handoff.
A human order taker is often finishing a payment, relaying a question to the kitchen or simply has not seen the car yet. That is what happens when one seat covers several jobs at once, and it is a matter of job design and not of effort. Across ~1,000 stores, Hi Auto’s greeting typically lands within 3-5 seconds. Hi Auto’s average response time is 1.52 seconds. A typical order has several exchanges, such as the item, the size, the modifier and the combo, so response time adds up across the conversation.
Both figures are Hi Auto’s own, and both describe the order point only. Window time, transaction time and cars per hour are timings you measure yourself. Hi Auto’s reported KPIs are completion, accuracy, average ticket and upsell consistency, and we report completion and accuracy together: 93%+ completion and 96% accuracy across ~1,000 stores.
When any vendor quotes greet time or response time, ask three things.
- Is it an average across all live production stores, or a best-location number? One strong site can flatter any metric.
- How is it measured? A loop sensor, a camera and an audio trigger each start the clock at a slightly different moment.
- Are completion and accuracy reported together? A fast greeting means little if the order falls apart halfway through.
The Buyer’s Guide advises asking every vendor for their measurement method.
Transaction Time and Window Time: Where the Kitchen and the Window Come In
Once the order is confirmed and the car rolls forward, ownership changes hands.
No single person owns window time. The kitchen has the bag ready, the window crew completes payment and the handoff, and the car has to be ready to receive it. All three have to line up. When window time runs long, the cause is usually a shared load and not one person’s pace.
Linda Ronda, Store GM at Checkers, described what changed for her team when the order point was covered:
“Now that we have her and she does everything for us, we’re able to say okay let’s get the order out let’s get the bag to beat the car, so it helps out a lot with her.”
Linda Ronda, Store GM, Checkers. Hi Auto customer video, 2025. Watch the clip
The fastest route to a shorter window time often begins earlier in the lane. An order that is right at the speaker means fewer corrections at the handoff, and a crew that is not also managing a headset can give the window its full attention. Window time is a timing you track yourself. What Linda’s team describes is a change in where their attention goes.
Cars Per Hour: What the Timings Add Up To
Cars per hour is often the number that starts the conversation. Franchisees compare it across locations, and it shows up on brand scorecards. It is easy to treat it as a dial you can turn directly.
It is better read as the outcome of every timing in the lane. When greet time improves and response time stays steady, those seconds carry through every car at the peak. If food is not ready when a car reaches the window, the window becomes the limit no matter how smooth the order was.
That is why cars per hour improves when every stop improves, and why the order point is a good place to start: the seconds there are the easiest to reach. Capacity tactics, such as lane design, dual-lane setups and stacking, are a separate topic. We cover them in How to Improve Drive-Thru Throughput: A Tactical Franchisee’s Guide, and our throughput glossary entry gives the definition.
What Independent Evidence Says About AI and Service Time
One outside data point is worth putting in context before you act on it.
Intouch Insight’s 2026 Drive-Thru Study compared 120 mystery-shop visits to locations of three national QSR brands running voice AI with 495 visits to the same brands in its main study. Total visit time was almost the same: 5:14 at the AI locations, against 5:15. The wait before ordering was 11.1 seconds shorter, and the time from placing the order to leaving was 10.2 seconds longer. The finding belongs to the study and not to any single vendor.
Note what was measured. The study splits the visit into the wait before ordering and the time from ordering to leaving, and the AI locations gained on one and gave time back on the other. When a vendor quotes a speed figure, ask which stretch of the lane it covers.
Treat it as a directional signal, not a promise. Your daypart mix, order complexity and kitchen setup will all shape your own result. The split is a good reason to look closely at each stop, starting with the order point.
Which Timing to Work on First
A daily average can hide the busiest hour of the day. A store that looks fine over 24 hours may have a greet-time problem only at lunch. Here is a sequence to work through.
- Start at the speaker. Greet time and response time are the timings most within reach of a process or technology change. Measure them by daypart and not just by day.
- Then look at the handoff. Before you coach the window team, check whether the bag is ready when the car arrives, and whether orders are right. A wrong order means a remake, and a remake costs time at the window.
- Then look at the window itself. Payment speed, window layout and handoff habits are real levers. They are slower to change, so take them after the first two are steady.
Measurement discipline matters as much as the sequence. Compare daypart against daypart and week against week. Change one thing at a time, then give it two to four weeks. If you change staffing and add AI in the same week, you cannot tell which one moved the number. The drive-thru KPIs glossary entry gives a wider framework for what to track.
Consistent data across locations is what turns a hunch into a decision. Jason Amell, Director of Operations at JASAM Enterprises, described the value of that view:
“It gives you insight into your restaurant when you’re not there. That is probably more valuable to me than even the system that takes the orders.”
Jason Amell, Director of Operations, JASAM Enterprises (Checkers & Rally’s, 27 stores, Michigan). Hi Auto customer video “Real Stories from the Drive-Thru Frontline”, 2025. Watch the video
Questions to Ask Any Vendor That Promises a Faster Lane
Every demo looks good in a controlled setting. The real test is your 15th location on a Friday lunch rush. Five questions help.
- Which timings does your system affect, and how is each one measured? Greet time and response time belong to the order point. Window time and transaction time also depend on the kitchen and the handoff.
- Are your figures an average across all live stores, or a best-location number? A pilot at one strong store does not predict your 20th location.
- Do you report completion and accuracy together? Ask for both numbers side by side. Hi Auto reports 93%+ completion and 96% accuracy across ~1,000 stores.
- What happens to an order the system cannot confidently resolve? With Hi Auto’s AI Order Taker, human backup finishes the order in the moment, so it still gets completed correctly. Ask any vendor to show you how theirs works.
- What does the timeline look like, and what support comes after go-live? A Hi Auto pilot can be live in about 8 weeks, and the path from pilot to scale runs 90-120 days.
Fix the Speaker First, Then Look Down the Lane
Operators who want more cars per hour often start by watching the window. It is visible, the car sits there, and the crew feels the pressure most. That is a natural place to look.
The window sits downstream of everything that happened at the speaker. A quick, accurate order gives the kitchen a clean start, and it leaves the window crew with one job: handing over the right bag. When the order point runs slow or unclear, the window inherits it. Your crew is absorbing something that began earlier in the lane.
So work in lane order. Fix the timing you control first at the speaker, then the handoff, then the window. Measure by daypart and change one thing at a time.
Call to action
If you are weighing AI at the order point, start with the Buyer’s Guide evaluation matrix so you know what to ask any vendor. Then talk to the Hi Auto team about what a pilot would look like for your stores.
Open items for Hi Auto
- Confirm Hi Auto’s reported KPIs remain completion, accuracy, average ticket and upsell consistency, so no lane timing is described as reported by Hi Auto.
- Confirm the 3-5 second greeting and 1.52 second average response time are current platform figures across ~1,000 stores.
- Please confirm the figures from Intouch Insight’s 2026 Drive-Thru Study can be cited from Intouch’s own published report, since QSR Magazine’s coverage does not carry all of them and Hi Auto’s sourcing rule favours independent coverage.