TL;DR
- Four drive-thru numbers deserve the top of a multi-unit dashboard: completion rate, order accuracy, average ticket and upsell consistency.
- Always read completion and accuracy together. Hi Auto reports 93%+ completion and 96% accuracy as an average across 100M+ orders processed per year.
- Compare stores like with like (same daypart, similar volume, similar menu) and look at the spread, not just the best store.
- Before you trust any vendor’s dashboard, ask what it reports, how each number is measured, at what scale, and how often it updates.
It is Saturday afternoon. You are at a family event, your phone is face down on the table, and three of your stores are working through the lunch rush without you. What you want is a quick, honest picture of how it went.
Jason Amell, Director of Operations at JASAM Enterprises, runs 27 Checkers & Rally’s stores in Michigan. He described what a dashboard gives him:
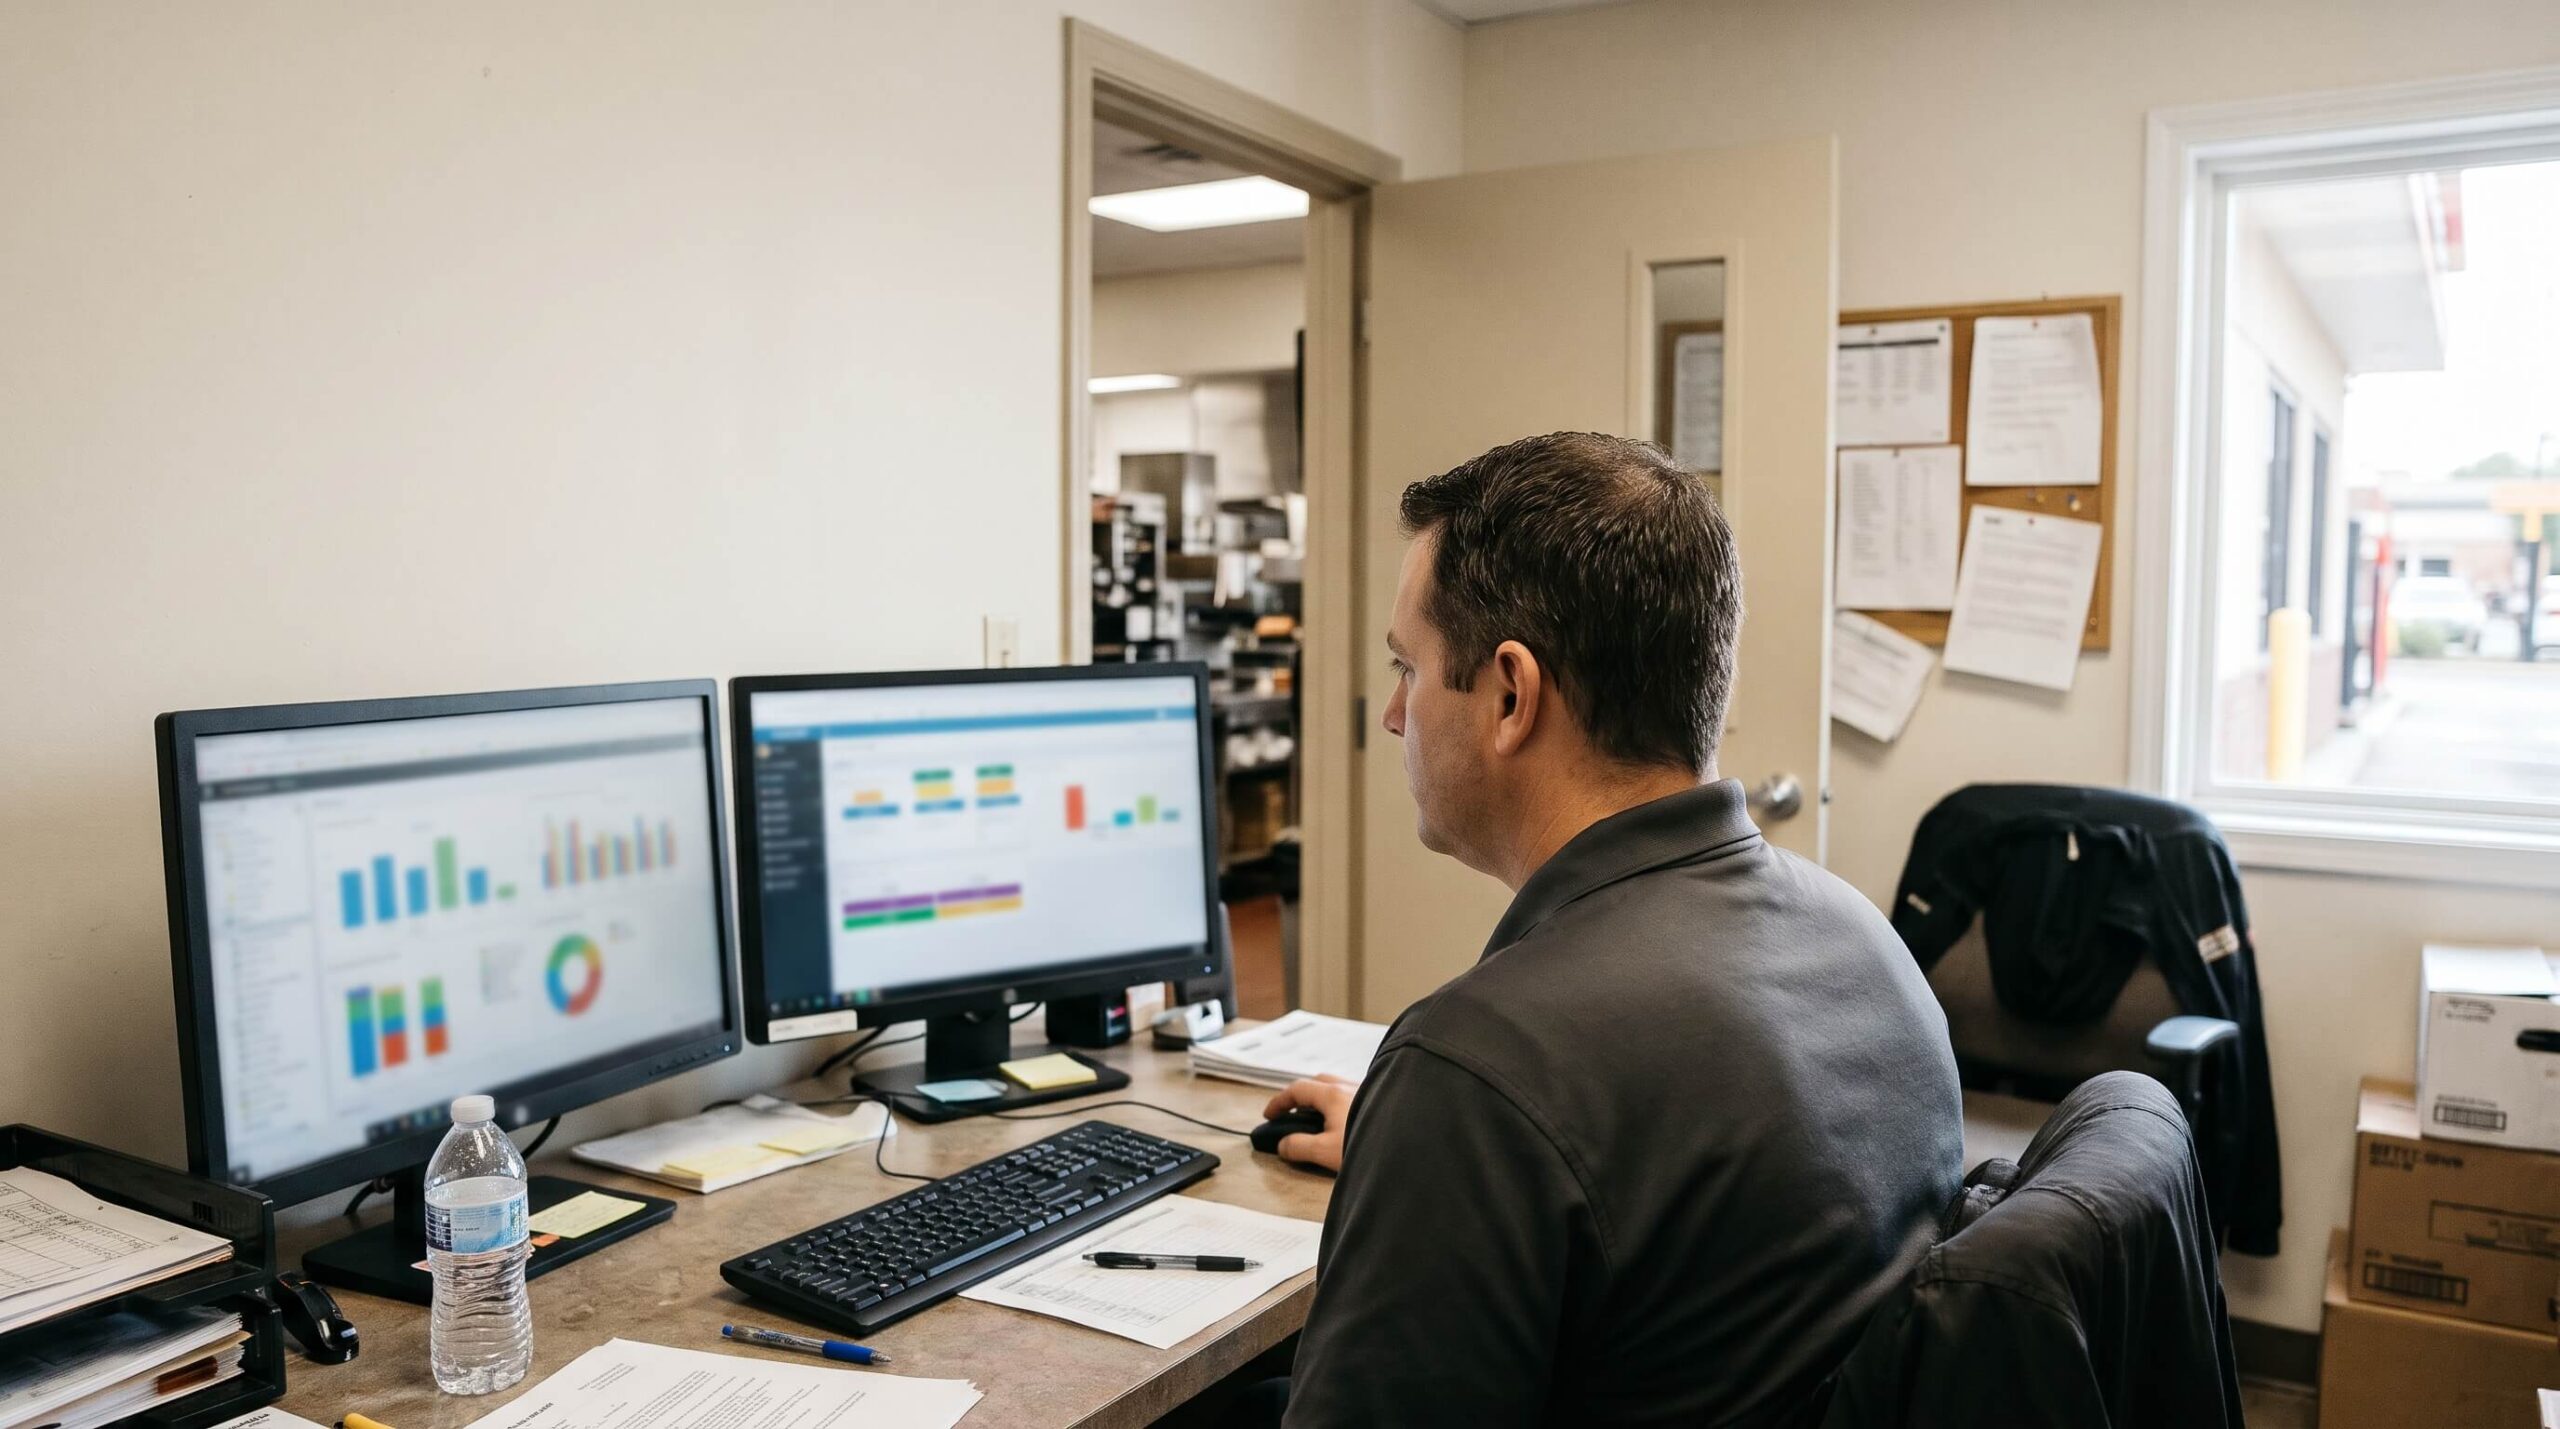
“It gives you insight into your restaurant when you’re not there. That is probably more valuable to me than even the system that takes the orders.”
Jason Amell, Director of Operations, JASAM Enterprises. Hi Auto customer video “Real Stories from the Drive-Thru Frontline”, 2025. Watch the video
Operational performance is how consistently a store delivers its core service across every shift. This guide is for owners and area managers running several stores. It skips the definitions and spends its time on the choice: which few numbers belong on your dashboard, how to read them across stores, and what to ask any vendor to show you.
Start with the decisions, not the numbers
Most dashboards get built backwards. Someone lists everything the system can measure, drops it into a report and moves on. A few months later, nobody opens it.
Start with your calendar instead. Most owners and area managers make three decisions every week:
- Which store do I visit? You need a cross-store view that shows which location looks different from the rest.
- Which daypart is slipping? A store average can hide a weak lunch. You need the same number split by daypart.
- What do I raise with a manager? One odd day is a blip. A few weeks in the same direction is worth a conversation.
Work backwards from each decision to the number that supports it. If a number does not change what you do, it does not need a place on the screen. That is the thinking behind choosing drive-thru KPIs you will actually use.
The four numbers that lead
Four numbers cover most of what an owner needs to know about the ordering moment. Each one links to a decision above.
Completion and accuracy, always together
Completion rate is the percentage of orders sent to the POS without staff intervention. Order accuracy is the percentage of orders sent to the POS with every item and customization exactly right. Either one alone can mislead you. A high completion rate with weak accuracy means many orders are finished wrong. A high accuracy rate can hide how many orders never got finished.
For a reference point, Hi Auto reports 93%+ completion and 96% accuracy as an average across 100M+ orders a year. That is an average across all live stores, not a best-location result, which makes it a fair yardstick for your own stores. A store that sits below it week after week is a good reason to visit.
Average ticket
Average ticket shows whether each order is capturing its full value. Hi Auto sees a lift of ~1.5% (1 to 2%) per store, a small gain on each order that comes from suggestive selling being consistent. Our guide to growing average check size covers the tactics in more depth.
Jose Armario, CEO of Bojangles, described what he saw:
“We’ve seen a healthy increase in average check as well because she’s one of the best salespeople on the team with order taking or suggestive selling.”
Jose Armario, CEO, Bojangles. QSR webinar “AI Order Taker That Works: The Bojangles Model”, July 2025. Watch the clip
Upsell consistency
Upsell consistency asks a different question from average ticket: how often is an upsell offered at all? A human order taker at a busy window is juggling a headset, food, cash and the window at once, so it is natural for suggestions to vary from order to order. Lee’s Famous Recipe Chicken reports upsell on 100% of orders with Hi Auto, compared with roughly 20% before. Seeing that number by store shows you where the offer is landing on every car.
Together, these four numbers give you a short list you can read in a couple of minutes.
Store-level nuances that explain the numbers
A number without context can send you in the wrong direction. Say completion looks low at one store on a Tuesday night. It might be a real dip. It might also be that the store closed early that evening, so the figure covers a shorter and unusual shift.
Hi Auto’s dashboard includes insights such as early closes, delivery-only periods, missed orders and other store-level nuances. Here is why each one matters when you read a number:
- Early closes. A short shift changes the totals. Knowing the store closed early tells you the dip may be about the schedule, so you can ask about the closure instead of the numbers.
- Delivery-only periods. When a store leans on delivery, the mix of orders shifts. Comparing its ticket to a neighbouring store in the same daypart would not be a fair comparison.
- Missed orders. Seeing these by store helps you tell a one-off from a pattern building across shifts.
The four leading numbers show you what happened. These insights show you why. Getting the reason first means the call to your manager starts from understanding, not from a guess.
How do you compare stores fairly?
A raw ranking of stores is one of the quickest ways to reach the wrong conclusion. Before you call anyone, check what you are comparing. A fair comparison needs three things:
- The same daypart and day type. A Friday dinner rush and a Tuesday lunch have different volume, menu mix and rhythm. Compare lunch with lunch and weekend with weekend.
- A similar volume tier. A store with a steady line of cars all day works under different conditions from a quiet one. The same number can mean different things in each.
- A similar menu. A location running a limited-time offer with many modifiers has a busier job than one on the standard menu.
Once the comparison is fair, look at the average and the spread instead of the top store. Owners naturally celebrate their best location. The bigger opportunity is usually the gap between your middle stores and your lowest, because closing that gap lifts the whole group.
One term helps here. Lane-level analytics means you can see performance for a single lane, not only for the whole store. It is useful when two similar stores look different on paper. Keep any figure per store, and resist adding stores together. Each location has its own volume and its own story.
What to ask any vendor to show you
Before you commit to a reporting platform, ask four questions. The answers will tell you more than a sales deck.
- What do you report, and how is each number defined? “Completion” can mean an order that was started or an order that reached the POS. Those give very different numbers under the same label. Ask for the exact definition of every metric before you compare anything.
- Is that figure an average across all live stores, or a best-location result? A headline number from one strong pilot store can make any system look good. Ask for the average across every live store, plus the range. Hi Auto’s Buyer’s Guide advises asking every vendor for their measurement methodology, not only their top-line result.
- At what scale was it measured? A handful of stores is a pilot. Hundreds of stores is a deployment. Ask for the store count behind every statistic.
- How often does it update? Ask how soon new orders show up on the dashboard. Hi Auto’s dashboard shows data within a day, which is enough to act on a slipping daypart this week.
Then ask what else the platform reports, such as abandonment, service timings or greet time. Whether a vendor tracks these, and how reliably, is part of your evaluation. Hi Auto’s reported KPIs are completion, accuracy, average ticket and upsell consistency. Our product page shows how the ordering side works.
Setting up a dashboard people use
A dashboard sticks when it comes with a routine. Three habits make the difference:
- A weekly review. Pick one fixed time to look at the four leading numbers across all your stores. Note any location outside its usual range and decide which manager conversation to have.
- A daily glance for exceptions. Spend five minutes checking for anything unusual overnight, such as an early close, a jump in missed orders or a completion dip in one daypart. You are looking for what needs a call today.
- One owner per number. Give each metric one person, and agree what they do when it moves.
If you are considering AI order taking, plan for the routine early. A Hi Auto pilot goes live in about 8 weeks, and getting from pilot to scale takes 90 to 120 days. Hi Auto support runs 24/7/365. Coaching crews with order data is a separate topic that we cover elsewhere. This guide is about the view an owner or area manager takes across locations.
A dashboard earns its place on Monday
The real test of a dashboard is whether it changes what you do on Monday morning. You need a small set of numbers that tell you which store to visit, what to ask the manager and where something slipped. Everything else is context.
Call to action
Ready to see what a dashboard could look like across your stores? Read the evaluation matrix in the Hi Auto Buyer’s Guide: AI for the Drive-Thru, then talk to the Hi Auto team. Bring your store list and your biggest blind spot, and start there.